
An estimated 6.77 per cent of people in private households in Leeds had the virus in the seven days to January 6, up from 4.3 per cent in the previous week, according to the Office for National Statistics (ONS).
The figures show 4.3 million people across the UK had Covid-19 in the seven days to January 6, a record high and up from 3.7 million in the previous week.
Leeds recorded an infection rate of 1,532.8 new cases per 100,000 people in the seven days to January 11, the latest available figures. It's down 27.3 per cent from the previous week.
Although rates are falling, some Leeds neighbourhoods have much higher rates than the city's average. Here we reveal the areas with the highest infection rates.
The infection rate is expressed as the number of new cases per 100,000 people. All images are for illustrative purposes only.
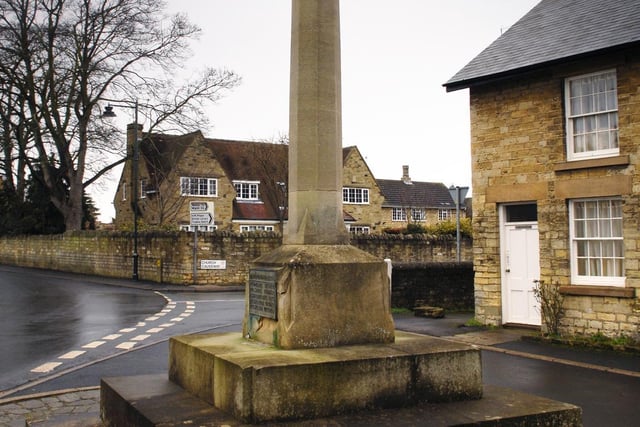
1. Wetherby East and Thorp Arch
Wetherby East and Thorp Arch recorded an infection rate of 2,202.8 in the seven days to January 11. It’s down 25.4% from the previous week.
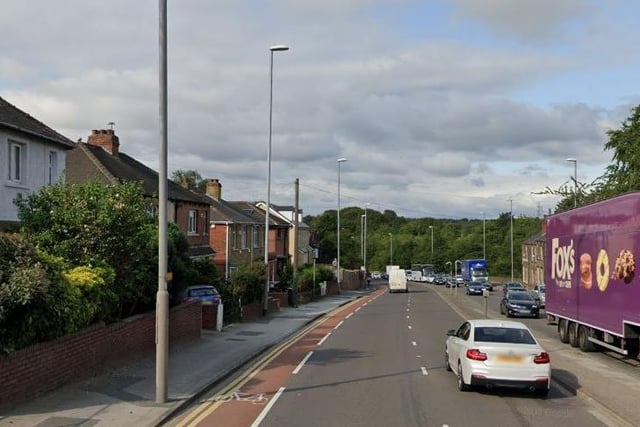
2. Bramley Park South
Bramley Park South recorded an infection rate of 2,196.6 in the seven days to January 11. It’s down 19.5% from the previous week.
3. Morley Bruntcliffe & Woodkirk
Morley Bruntcliffe & Woodkirk recorded an infection rate of 2,182.4 in the seven days to January 11. It’s down 11.2% from the previous week. Photo: Google
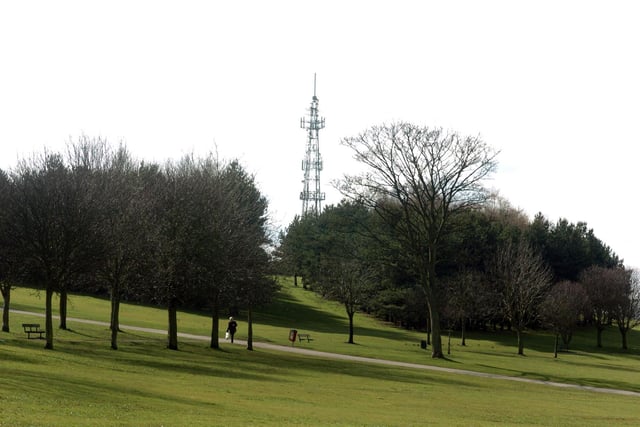
4. Seacroft South
Seacroft South recorded an infection rate of 2,120.5 in the seven days to January 11. It’s down 30.6% from the previous week.
5. Farnley West & Gamble Hill
Farnley West & Gamble Hill recorded an infection rate of 2,071.7 in the seven days to January 11. It’s down 20.8% from the previous week. Photo: Google
6. Bramley Fall
Bramley Fall recorded an infection rate of 2,046.6 in the seven days to January 11. It’s down 8.4% from the previous week. Photo: Google